Climate modeling lab at Vienna Scientific Cluster
Climate modeling lab at Vienna Scientific Cluster
Meteorology students from the University of Vienna worked with the ICON global climate model at the Vienna Scientific Cluster to study geoengineering options.
Article by Aiko Voigt and Dorian Spät (lecturers) with input from Daniel Stanka, Isabella Winterer, and
Nadiia Tolstukha (students).
The Master “Meteorology and Climate Science” at the Department of Meteorology and Geophysics at the University of Vienna emphasizes research-oriented teaching. The course Climate Modeling Lab, held in the summer term of 2024, is one example of this effort: the students were granted access to the VSC-4 supercomputer of the Vienna Scientific Cluster and performed their own simulations with the state-of-the-art global climate model ICON.
The idea of the simulations was to study the feasibility of some suggested geoengineering options [1]. To this end, the students ran and compared four simulations. A present-day control simulation and a simulation with quadrupled atmospheric carbon dioxide assessed the impact of anthropogenic global warming. Two additional simulations with quadrupled carbon dioxide and either decreased insolation or transparent stratospheric water vapor addressed the potential for geoengineering. The former simulation studied the cooling effect of stratospheric aerosol and space mirrors that work via decreasing the amount of shortwave – or visible – radiation; the latter simulation aimed to cool the planet by increasing the amount of longwave – or thermal – radiation that Earth emits to space.
The carbon dioxide increase resulted in profound regional changes in surface temperature and precipitation (Fig. 1). Consistent with other climate models and the IPCC Assessment Report AR6 [2], the Arctic and land regions show particularly strong warming. While the deep tropics and higher latitudes experienced more precipitation, rainfall declined in many subtropical regions and the Mediterranean region. In the global mean, surface temperature increased by 6.5°C, well in line with a climate sensitivity of 3°C, and sea ice cover decreased by a whopping 50 percent. These changes illustrated the severity of human-induced climate change.
When the strength of the sun (that is, the solar constant) was reduced by 3 percent, a large part of the carbon dioxide warming and sea ice melt was avoided: instead of a global mean warming of 6.5°C, the warming was limited to 2.4°C (Fig. 2). While the 3 percent reduction was chosen to offset the entire radiative forcing of the CO2 increase, powerful amplifying cloud and sea ice albedo feedbacks nevertheless led to substantial warming. By comparison, the simulation with transparent stratospheric water vapor only mitigated 0.4°C of warming, which is less than 10 percent of the CO2-induced change. This feeble cooling calls into question a recent proposal to dry out the stratosphere [3].
By working with the ICON model and VSC, the students were confronted with several challenges, ranging from compiling and running the model, to analyzing large datasets, to organizing their team work in an efficient manner. However, these challenges were instrumental in deepening their understanding of climate modeling and in getting some hands-on experience of doing research in a collaborative setting.
We are grateful to VSC for supporting our teaching activities and look forward to the climate modeling
lab in 2025!
Feedback from students
“The project was a great opportunity to work hands-on. By running ICON on VSC with our modifications we worked directly with the output data. As a team, we came up with ideas about the story we wanted to tell with the data and what was needed for that. By trying and discussing we were able to navigate through the large amount of data and possibilities to achieve that. Along the way we gained a better idea of how research is done.”
“The climate modeling lab was an eye-opening experience that highlighted the power and complexity of climate models. By simulating various scenarios, we gained a clearer understanding of the potential impacts of climate change and possible mitigation strategies. Access to VSC was invaluable, providing us with the resources needed to perform advanced simulations and prepare for future challenges in climate research.”
Afterword
The VSC access for students was facilitated by EuroCC Austria – National Competence Centre for Supercomputing, Big Data and Artificial Intelligence. Together with EuroCC Austria, VSC supports the next generation of HPC users who are confident in using sophisticated tools to tackle complex problems in climate research and other fields of science.
The collaboration of VSC and EuroCC Austria with the teaching staff of Austrian universities is ongoing. You can read about some of the past projects here and here.
Further reading
Model output and analysis scripts can be obtained from the PHAIDRA repository for the permanent secure storage of digital assets at the University of Vienna at phaidra.univie.ac.at/detail/o:2082179
[1] Ricke, K., J. S. Wan, M. Saenger, and N. J. Lutsko (2023), Hydrological Consequences of Solar Geoengineering, Annual Review of Earth and Planetary Sciences, 51, 447-470, doi.org/10.1146/annurev-earth-031920-083456
[2] Arias, P.A. et al. (2021), Technical Summary. In Climate Change 2021: The Physical Science Basis. Contribution of Working Group I to the Sixth Assessment Report of the Intergovernmental Panel on Climate Change, Cambridge University Press, Cambridge, United Kingdom and New York, NY, USA, pages 33−144, doi.org/10.1017/9781009157896.002
[3] J. P. Schwarz, R. -S. Gao, T. D. Thornberry, A. W. Rollins, K. H. Rosenlof et al. (2024), Considering intentional stratospheric dehydration for climate benefits, Science Advances, 10, eadk0593, doi.org/10.1126/sciadv.adk0593
News article by Vienna Scientific Cluster vsc.ac.at/news/2024/news-records/climate-modeling-lab-at-vsc/
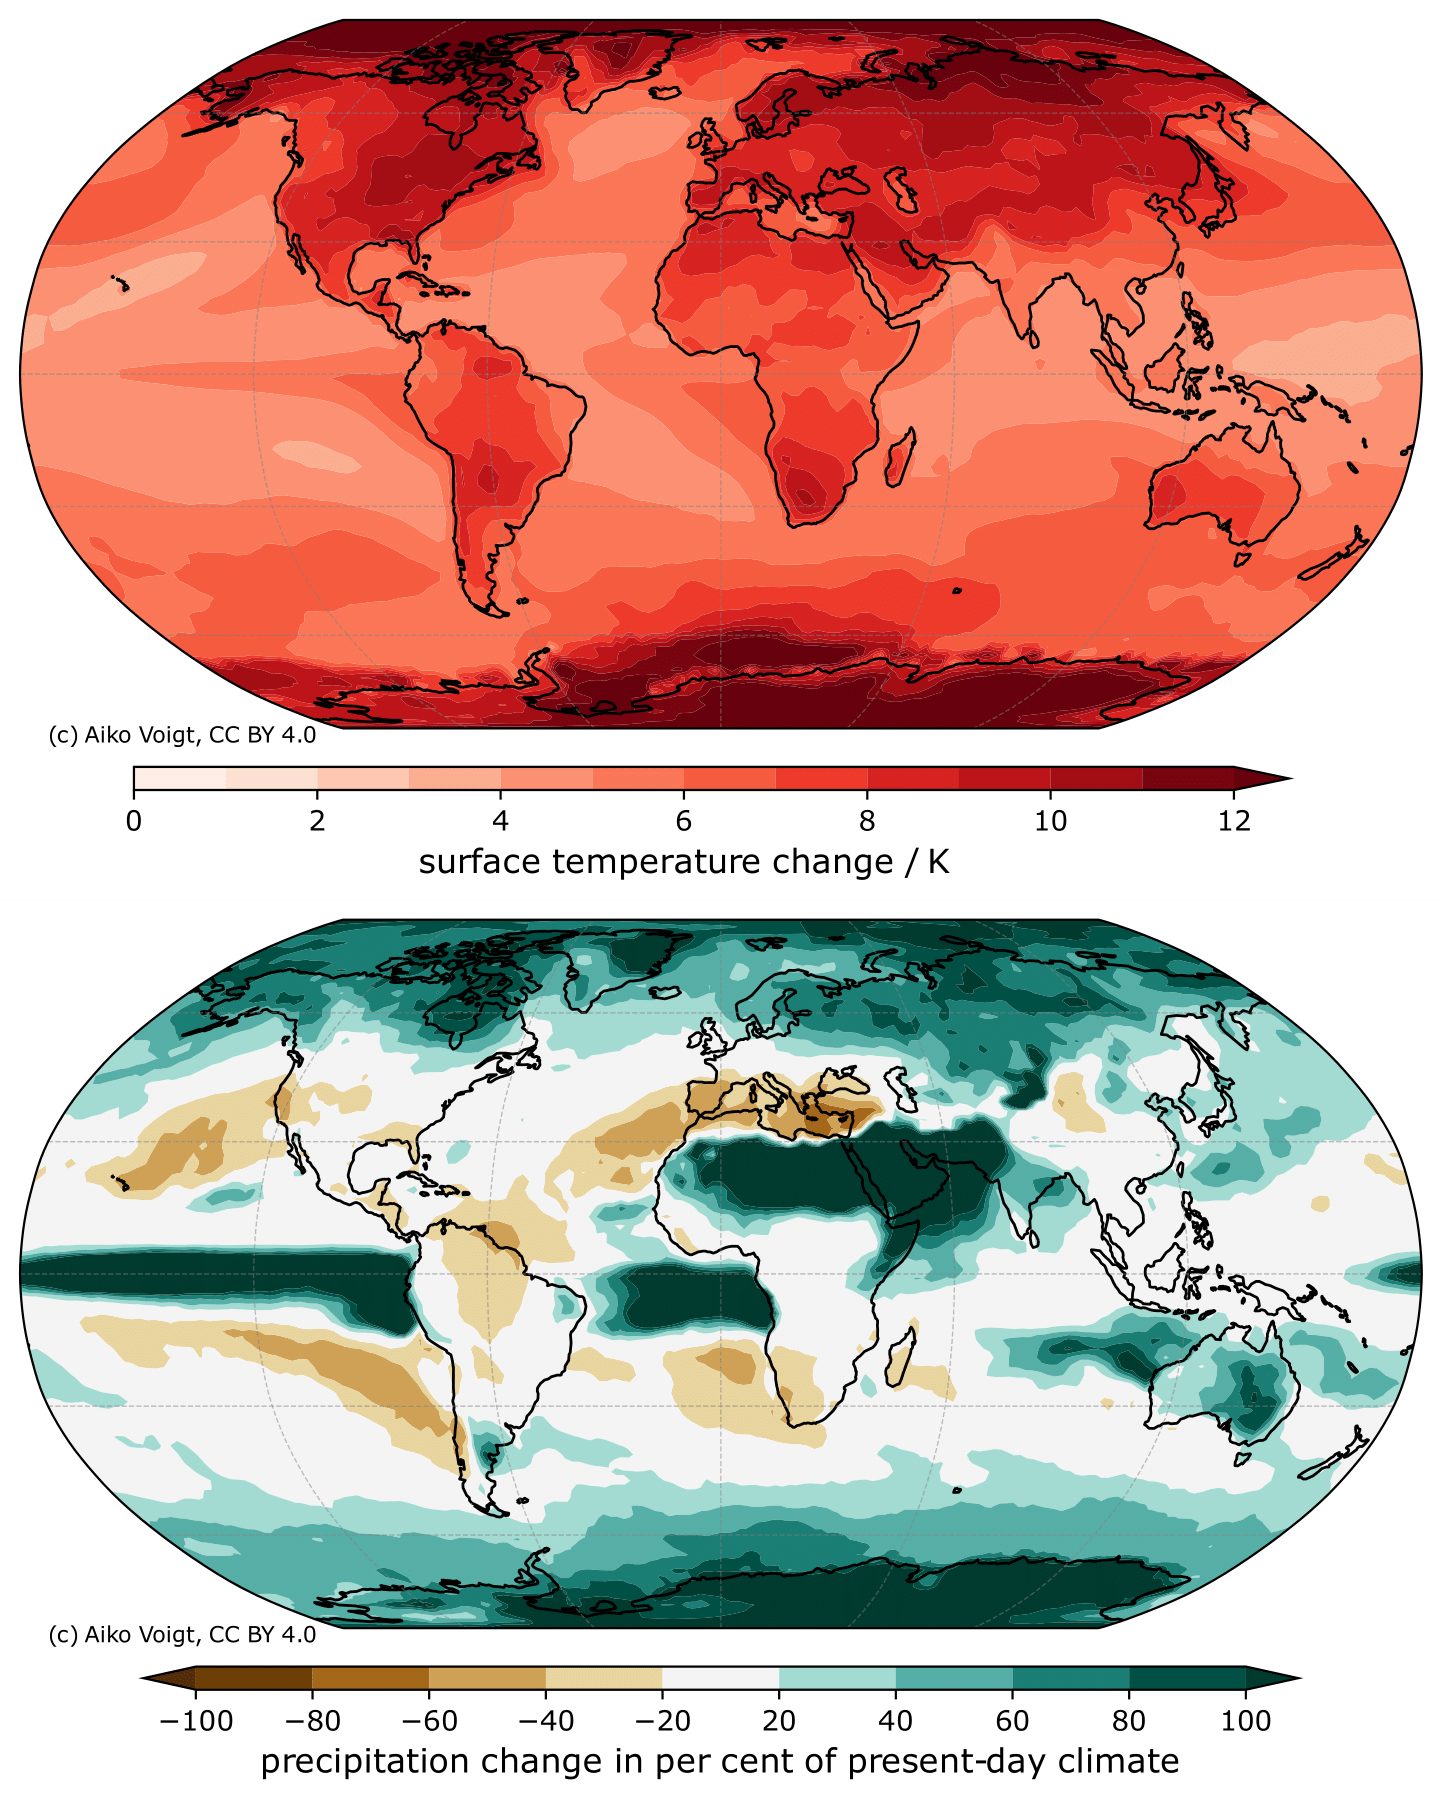
Figure 1: Response of surface temperature (top) and precipitation (bottom) to a quadrupling of atmospheric carbon dioxide © Aiko Voigt CC BY 4.0
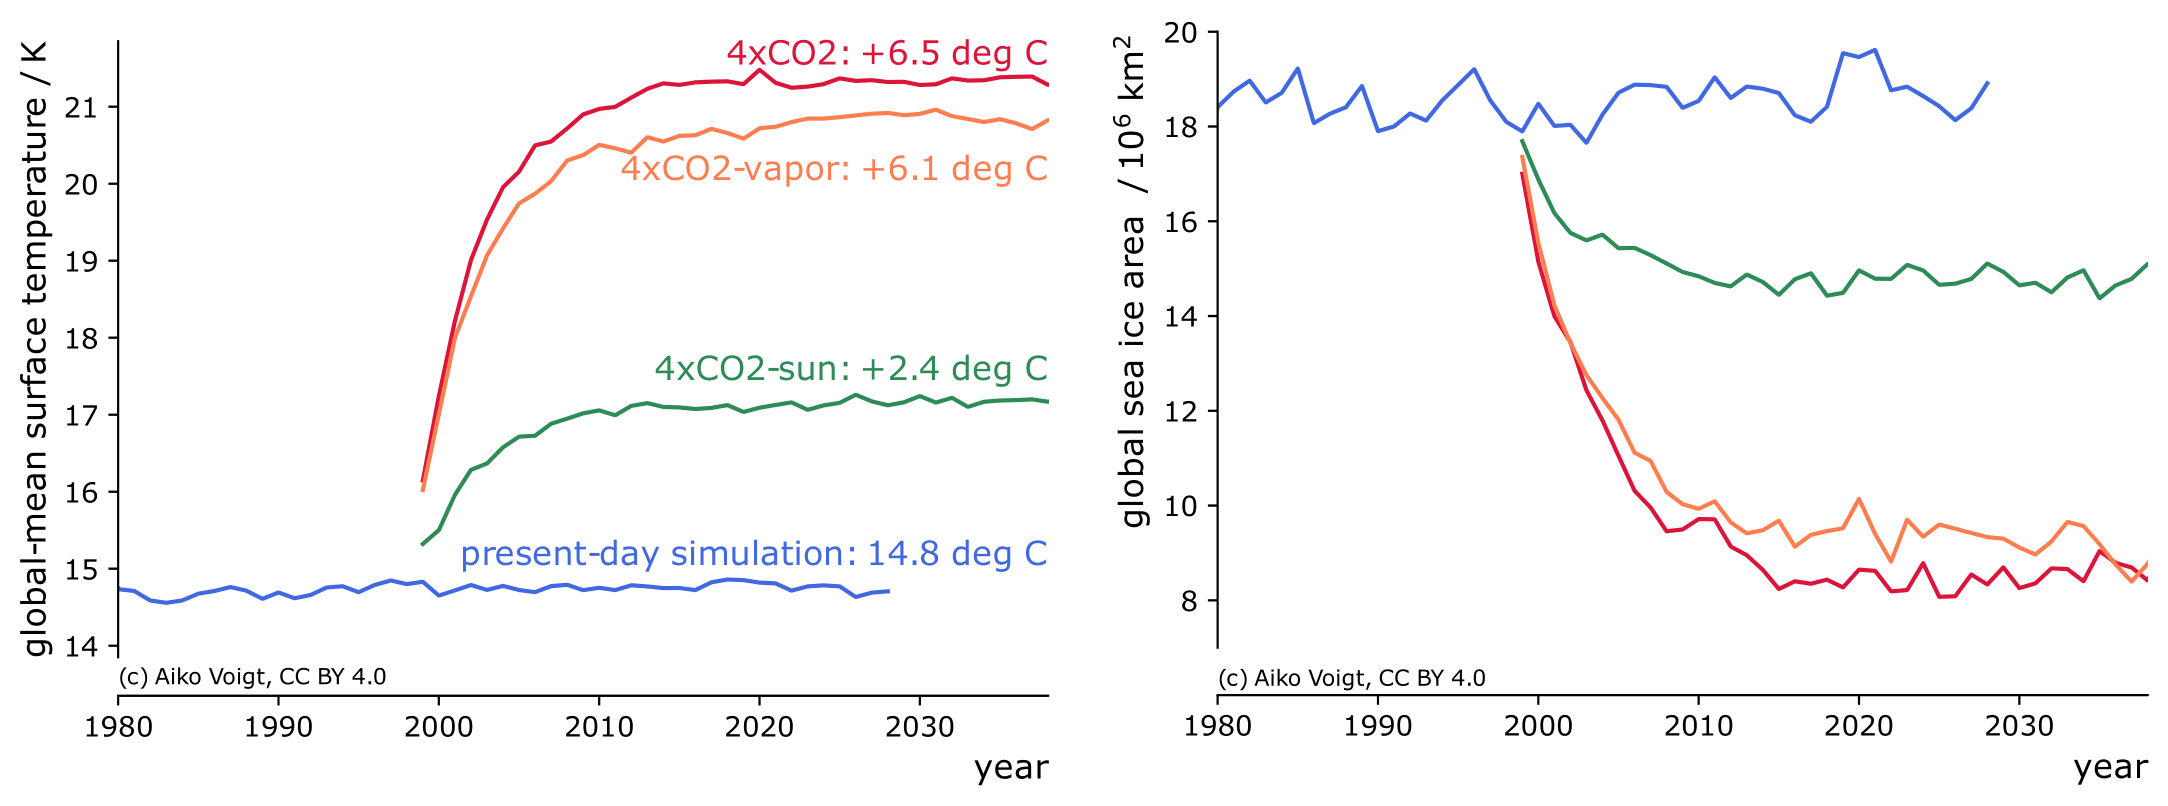
Figure 2: Response of surface temperature (left) and sea-ice area (right) to a quadrupling of atmospheric carbon dioxide in isolation (red) and together with two geoengineering approaches (orange and green). The control simulation is shown in blue for reference
© Aiko Voigt CC BY 4.0